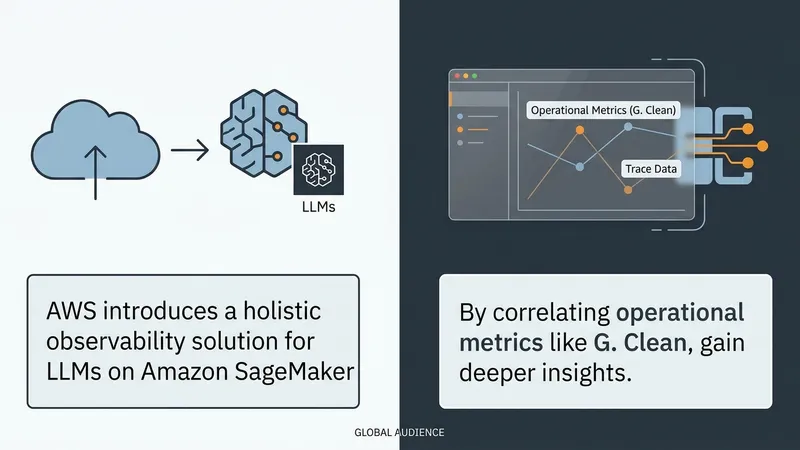
Deploying large language models (LLMs) at scale on Amazon SageMaker AI Inference makes observability a critical pillar of any production machine learning (ML) strategy. Unlike conventional software that returns deterministic outputs, LLMs generate variable, free-form responses that are difficult to validate with standard metrics. LLM output quality can change over time as input distributions shift, and quality monitoring helps detect these changes early. For generative AI workloads, observability also includes the model serving infrastructure, where unpredictable token consumption, GPU memory pressure, and latency spikes make capacity planning and cost control a moving target.
A comprehensive observability approach for LLM inference must address two distinct but complementary dimensions: model serving infrastructure (quantity) and LLM quality. Quantity monitoring focuses on the operational health of inference infrastructure, tracking request throughput and resource utilization. These metrics help detect bottlenecks, right-size compute resources, and control costs. Quality monitoring focuses on the performance of the LLMs themselves, evaluating response accuracy, compliance, and consistency over time.
Most teams build LLM observability in stages. The first stage establishes visibility into core operational metrics such as latency, errors, and resource utilization. These signals confirm the reliability of inference endpoints. The next stage adds LLM quality through sampling and evaluation, which surface issues such as model drift, degradation, or unexpected behavior in generated responses.
With both dimensions in place, you can introduce thresholds and automated alerts that combine infrastructure and quality signals. Over time, the practice extends to comparative analysis across models and configurations so you can continuously tune cost, performance, and output quality. Quantity and quality metrics are interdependent: an endpoint can appear operationally healthy while producing poor or unsafe responses, or it can deliver high-quality outputs while running efficiently on over-provisioned infrastructure. Production-grade LLM observability emerges when both dimensions are monitored, correlated, and optimized together.
This post demonstrates a comprehensive observability solution using Amazon Managed Grafana dashboards that provides a holistic view of both quality and quantity for LLMs served on Amazon SageMaker AI endpoints with inference components. The workflow architecture is built using three core AWS services: Amazon SageMaker AI endpoints with inference components, Amazon CloudWatch, and Amazon Managed Grafana.
[AgentUpdate Depth Analysis] As AI Agents transition from isolated sandbox experiments to complex production systems, LLM observability becomes an absolute necessity. AI Agents operate through multi-step reasoning loops and tool integrations, where minor infrastructure latencies or prompt drift can compound exponentially across the execution graph. AWS's dual-dimension approach—correlating infrastructure telemetry with output quality evaluation—sets a robust operational blueprint. While specialized tools like LangSmith focus heavily on prompt tracing and engineering, AWS leverages its mature cloud-native stack (SageMaker, CloudWatch, Grafana) to provide unparalleled hardware-level insights synchronized with model evaluation. For the scaling AI Agent ecosystem, this cohesive monitoring capability is vital for managing critical cost-performance trade-offs, paving the way for the next frontier: multi-agent collaborative tracing and dynamic compute allocation.