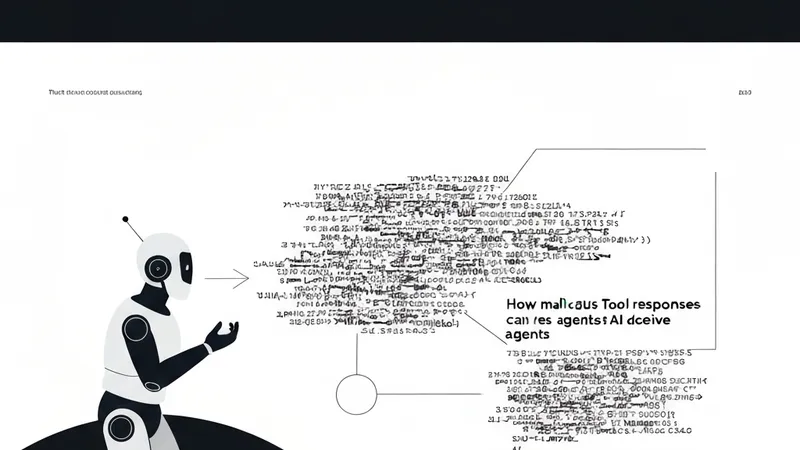
When AI agents execute tasks, they often extend their capabilities by calling external tools. From the agent's perspective, this might appear as a simple API call, but beneath this abstraction lies a complex web of syscalls, library calls, and kernel paths that the agent itself has no visibility into. This discrepancy between the agent's view and the underlying system behavior is the central focus of this discussion.
Currently, vendors are actively shipping MCP (Multi-tool Coordination Protocol) servers, with examples including Datadog, BlueCat, Command Zero, DBmaestro, the public CVE MCP, Grafana Cloud Remote MCP, and SAS Viya MCP. The agent-side abstraction for an MCP tool is minimal, consisting only of a tool name and a JSON schema. However, when the agent invokes such a tool, the underlying kernel-side surface—the actual operations performed—is extensive and largely unstated. eBPF provides the crucial capability to observe exactly what these tools touch at the system level.
What an MCP Tool Call Looks Like to the Agent
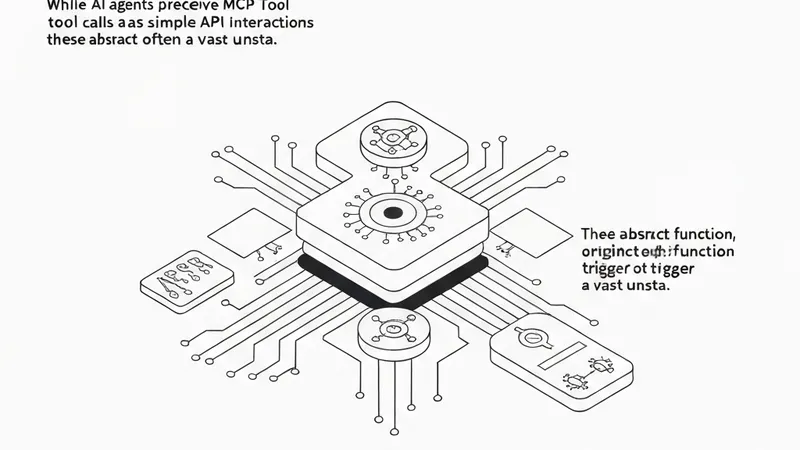
From an AI agent's perspective, an MCP tool is a function defined by a name and an input schema. The agent calls it, sending a JSON-RPC payload to the tool server, and receives a result. The MCP specification primarily covers transport and discovery mechanisms but does not dictate the tool's actions between the request and response. This gap is acceptable when the tool simply wraps a pure HTTP API. However, it widens significantly for tools that wrap a database client, a cloud SDK, a filesystem helper, or a GPU runtime. For instance, a "run query" tool could secretly spawn a subprocess, open a Unix socket, interact with an SDK that maintains a connection pool, and trigger kernel scheduling events that the agent will never observe.
What a Syscall Trace Reveals for the Same Call
To gain visibility into these hidden operations, an eBPF tracer can be pointed at the tool-server process while the agent issues the call. The trace will meticulously record all syscalls made by the tool, the libraries it loaded (resolved via /proc/[pid]/maps), the network endpoints it opened, and the CPU time spent in both user and kernel modes. With this data, the tool call is no longer an opaque box; the agent's abstract "run analysis" command maps to a concrete, observable path through the host system.
For example, using the ingero tool, one can capture and analyze an MCP tool's real footprint:
# Capture an MCP tool's real footprint while the agent calls it
ingero trace --pid $(pgrep -f mcp-server) --duration 30s \
  --out /tmp/mcp-tool-trace.db

# Then query the trace data to see what the tool touched
ingero query /tmp/mcp-tool-trace.db \
  "SELECT comm, syscall, COUNT(*) AS n\
     FROM host_events\
    GROUP BY comm, syscall\
    ORDER BY n DESC LIMIT 20"
Increased Importance for GPU MCP Tools
On a GPU host, the unstated kernel-side surface is even broader and more complex. A tool designed to "read GPU utilization" might execute nvidia-smi (involving a fork+exec), open device files like /dev/nvidia*, or link against libnvidia-ml.so. Furthermore, co-existing DCGM exporters add their own set of system interactions. While the agent still perceives a single tool name, the kernel observes numerous distinct execution paths. When an MCP-driven workflow experiences performance issues or incorrect behavior, the question of "which tool call is responsible" often stops at the JSON layer. However, by applying eBPF to the tool-server process, this inquiry can be pushed deeper, directly to the specific syscalls, library calls, and frequently, to the underlying CUDA driver calls, enabling precise diagnosis and troubleshooting.