While Prometheus and Grafana effectively monitor system anomalies like high CPU usage or container restarts, they often fall short in explaining *why* these issues occur. Manually sifting through Docker logs across numerous containers multiple times a day is a tedious and error-prone task, making it easy to miss critical insights.
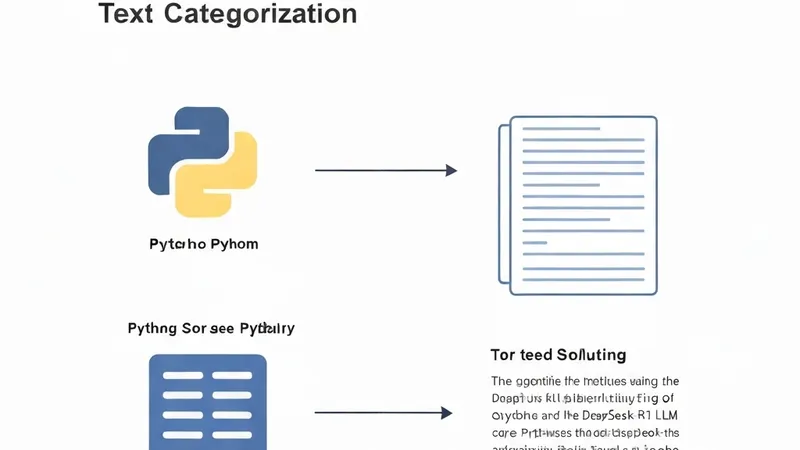
To address this gap, a Python script was developed to run every 15 minutes, pulling Docker container logs. It performs an initial classification to identify potentially critical entries, which are then forwarded to a small language model, DeepSeek-R1 1.5B (served via Ollama as a REST API) running on an Oracle Cloud instance. This LLM summarizes the raw log entries into plain English, and these summaries are subsequently posted to a Discord channel.
This approach offloads the burden of sifting through logs from human operators to an LLM, ensuring that users are only alerted when something genuinely critical occurs. While not a sophisticated AI agent with advanced tool use or multi-step reasoning, this straightforward automation combines rules-based triage with LLM-powered summarization. It effectively solves a real-world operational problem and offers valuable insights into practically integrating LLMs within an infrastructure workflow.
A common question might be, why not simply use Alertmanager for everything? The distinction lies between metrics and logs. While Alertmanager excels at handling metric-based alerts—such as CPU spikes or unreachable nodes—metrics and logs provide fundamentally different types of information.
For instance, a container might appear perfectly healthy from a metrics perspective—normal CPU, stable memory, responding to health checks—yet internally be logging critical errors. This could include failing to connect to an upstream API, constantly retrying a database connection every 30 seconds, or generating deprecation warnings that could evolve into breaking changes in future releases. None of these internal issues would surface in Prometheus metrics, but all would be evident in the logs.
Consequently, this log triage pipeline bridges the crucial gap between merely knowing that "the container is running" and understanding if "the container is truly healthy."
The log processing pipeline comprises four key components distributed across two machines:
On the local server (Waco, Texas):
- A Python script that reads Docker logs and classifies their severity.
- A cron job scheduled to run this script every 15 minutes.
- Docker, which hosts the containers producing the logs.
On the Oracle Cloud instance (Phoenix, Arizona):
- Ollama, serving the DeepSeek-R1 1.5B model as a REST API.
Connecting components:
- Tailscale, connecting both machines over an encrypted mesh VPN.
- Discord webhooks, receiving the final alert messages.
This architectural separation is intentional. The LLM runs on the Oracle instance due to its 24GB of RAM, which is sufficient to comfortably load a small model. The local server has less available headroom, and separating the LLM inference prevents it from competing for resources with the Docker services it monitors, ensuring operational stability.