
The first thing visitors see on 1000usdinchina.com is a map — an interactive SVG map of China with a clickable dot on every covered city. No Mapbox, no Leaflet, no tile server. Just hand-authored SVG. This post is about why, how, and the bug where the cities turned into black blobs.
This is post 4 of the series.
Table of contents
- Why raw SVG, not a map library
- City dots and interaction
- The black-blob bug
- SVG vs. canvas vs. tiles
- FAQ
Why raw SVG, not a map library
Map libraries are wonderful and completely wrong for this job:
- Size. Leaflet/Mapbox + tiles is hundreds of KB to megabytes. The map here is one inline SVG, a few KB gzipped, with zero runtime dependency.
- Edge-friendly. No tile requests, no API key, nothing to proxy through a Worker. It ships inside the HTML and renders instantly from cache.
- Control. I don't need streets and satellite imagery — I need a stylized outline and ~100 precisely placed dots. SVG gives pixel-level control over exactly that and nothing more.
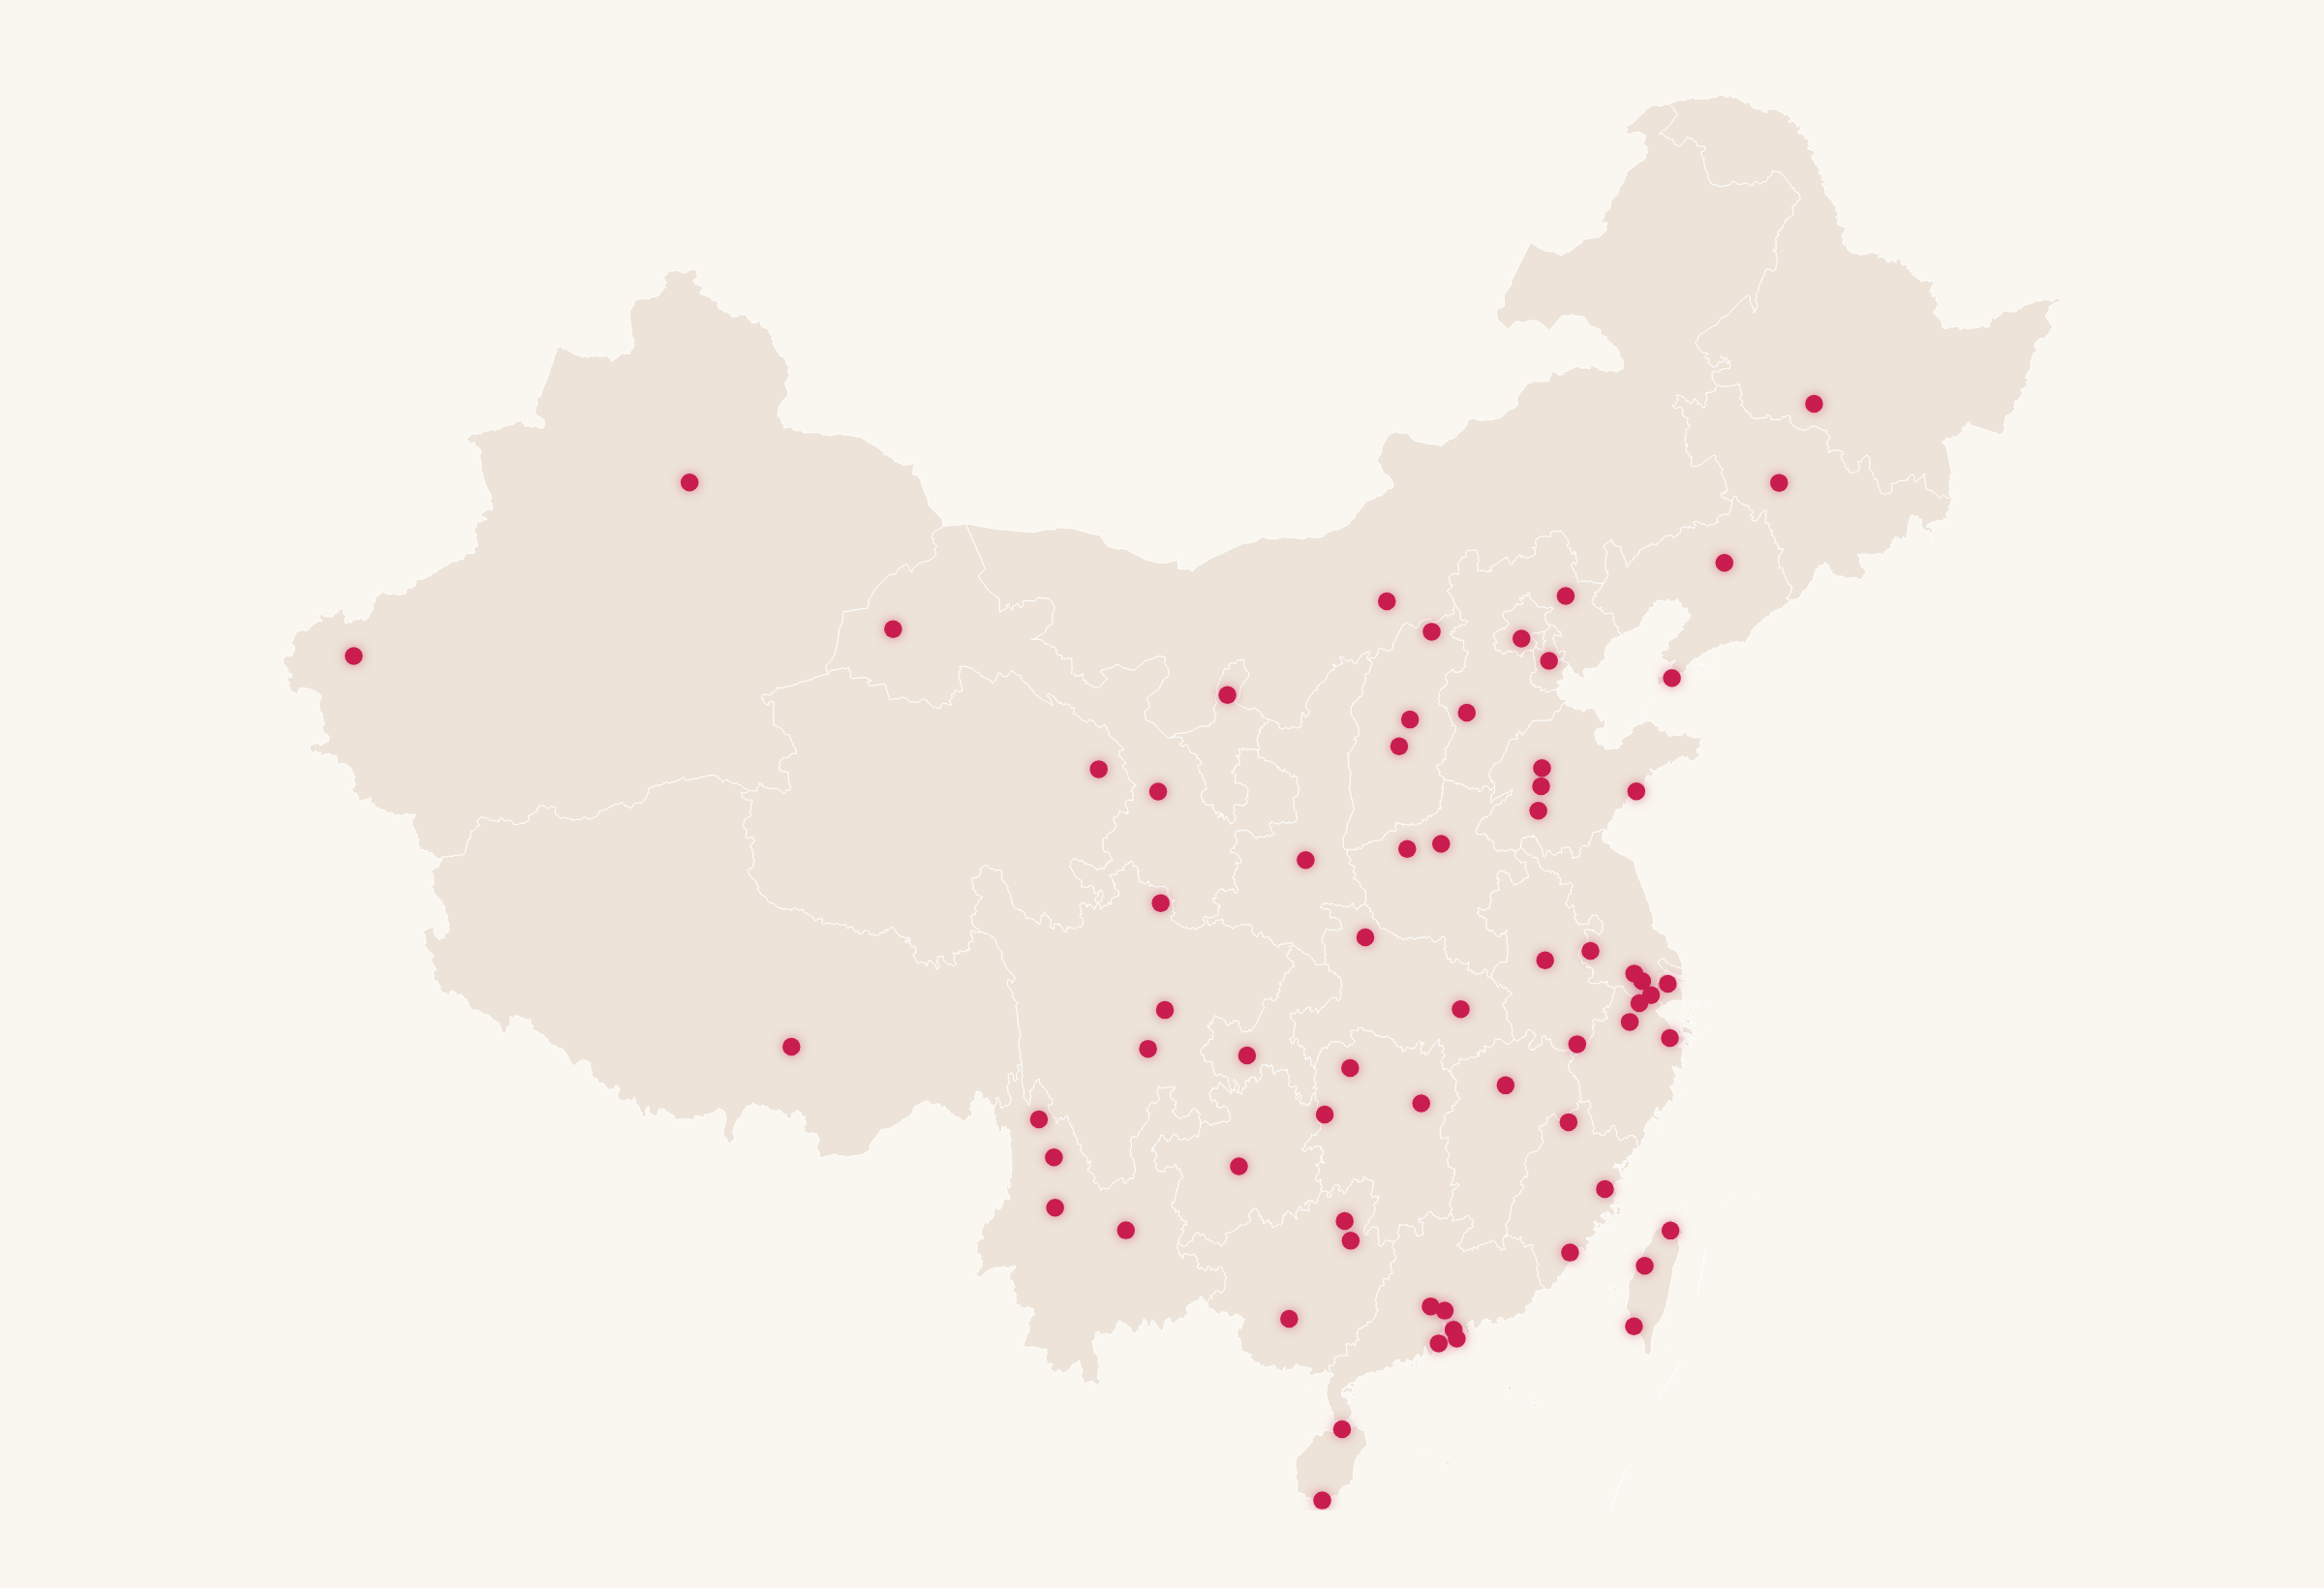
City dots and interaction
Each city is a <circle> positioned by projected coordinates, wired to hover and click:
<svg viewBox="0 0 1000 800" class="china-map">
  <path class="china-outline" d="M..." />
  <!-- one dot per covered city -->
  <a href="/en/city/chengdu">
    <circle class="city-dot" cx="486" cy="430" r="4"
            data-city="chengdu" aria-label="Chengdu" />
  </a>
  <!-- ... -->
</svg>
.city-dot { fill: var(--accent); transition: r .15s, fill .15s; cursor: pointer; }
.city-dot:hover { r: 7; fill: var(--accent-strong); }
Hover enlarges the dot, click navigates to the city. Because each dot is an anchor, it works without JavaScript and is keyboard-accessible — accessibility for free.
The black-blob bug
Here's the one that cost an afternoon. When the map was zoomed, clusters of cities turned into solid black blobs.
flowchart TD
    A[SVG had 67 extra city-dots baked in by an old generator] --> B[Those dots had NO CSS class]
    B --> C[Unstyled circle defaults to fill: black]
    C --> D[At zoom, dense unstyled dots merge into a black blob]
    D --> E[Fix: display:none the baked-in dots]
    E --> F[Do NOT regenerate from the generator — it has drifted]
The root cause: an earlier version of the map generator had baked 67 unstyled city-dot
elements directly into the SVG. An SVG <circle> with no fill specified defaults to solid
black. At normal zoom they were small and unnoticed; zoom in and the dense black dots merged
into a blob.
The fix was deliberately conservative: display:none the baked-in dots rather than
regenerating the whole SVG. Why not just re-run the generator? Because the generator had
drifted from the hand-tuned map that was actually in production — regenerating would have
"fixed" the blob and silently reverted dozens of manual position corrections. When a
generator has drifted from its hand-edited output, don't blindly regenerate. Patch the
symptom, keep the hand work.
SVG vs. canvas vs. tiles
For ~100 static points on a stylized outline, SVG wins:
| Inline SVG | Canvas | Tile map (Leaflet/Mapbox) | |
|---|---|---|---|
| Payload | A few KB | Small + JS | Hundreds of KB–MB |
| Dependency | None | Library | Library + tiles + key |
| Accessibility | Native (anchors, ARIA) | Manual | Partial |
| Edge-friendliness | Perfect (inline) | Good | Needs tile fetches |
| Right when... | Few hundred static features | Thousands of dynamic points | Real geography / streets |
Canvas earns its keep at thousands of animated points; tile maps when you need real streets. For a stylized 100-dot map on the edge, inline SVG is the smallest, fastest, most accessible option.
Key takeaways
- For ~100 static features, hand-authored inline SVG beats a map library on size, speed, and accessibility.
- Anchor-wrapped dots give you navigation and keyboard support with no JavaScript.
- A solid-black blob on zoom is the signature of unstyled SVG circles (default fill: black).
- If a generator has drifted from hand-edited output, patch the symptom — don't regenerate and lose the manual work.
FAQ
Can you build an interactive map without a map library? Yes. For a stylized map with a fixed set of points, inline SVG with anchor-wrapped circles gives interaction, navigation, and accessibility with no dependency.
Why did my SVG circles turn black?
An SVG <circle> with no fill defaults to solid black. Add a CSS class or fill attribute;
densely packed unstyled circles merge into a blob when zoomed.
When should I use canvas or a tile map instead? Canvas for thousands of dynamic/animated points; a tile map (Leaflet/Mapbox) when you need real streets, satellite imagery, or true geographic projection.
Next → How I shipped this app solo with Claude Code: prompt, context, harness & loop engineering